GEICO cut a third of its workforce. Berkshire posted record operating earnings. Revenue per employee climbed 39% in five years. The numbers tell a story that Warren Buffett’s final shareholder letter didn’t dwell on — and it’s one playing out across corporate America.
The Numbers at a Glance
Berkshire Hathaway’s 2024 fiscal year delivered $47.4 billion in operating earnings, a 27% increase over 2023 and the highest in company history. Full-year 2025 pulled back slightly to $44.5 billion, but remained the second-best year on record.
Meanwhile, the company’s workforce shrank. From a peak of 396,500 employees in 2023, headcount fell to 392,400 in 2024 and 387,800 in 2025 — a net reduction of approximately 8,700 workers over two years.
These aren’t contradictory facts. They’re the same fact viewed from different angles.
Revenue Growth Without Headcount Growth
Since 2020, Berkshire’s revenue has grown approximately 50%, from $245 billion to $368 billion. Over the same period, headcount grew just 8% — and has been declining since 2023.
 Figure 1: Berkshire Hathaway revenue indexed to 2020 vs. headcount indexed to 2020. The 42-point gap represents value generated without proportional workforce expansion.
This divergence has a direct financial translation. Revenue per employee climbed from $681,000 in 2020 to $949,000 in 2025 — a 39% increase in the value each worker generates for the conglomerate.
 Figure 2: Revenue per employee has risen steadily, approaching the $1 million mark.
The GEICO Case Study: Profit Through Workforce Reduction
The starkest example within Berkshire’s empire is GEICO, its auto insurance subsidiary. Between 2020 and 2024, GEICO cut its workforce from 42,156 to approximately 28,247 — a 33% reduction, or roughly 13,900 jobs eliminated.
The results were dramatic. GEICO’s combined ratio (the key insurance profitability metric, where below 100% means underwriting profit) improved from a loss-making 97% in late 2022 to an exceptional 81.5% in 2024 — the best in the subsidiary’s modern history. The expense ratio fell below 10%, compared to an industry norm of 25-30%.
In Buffett’s framing, this was a turnaround story. In labor terms, it was $1.3 billion in annual wage costs removed from GEICO’s books, replaced by technology and process optimization. The remaining employees are generating significantly more value per person — but their compensation hasn’t kept pace with that productivity gain.
Where the Value Flows: Profit Per Employee vs. Compensation
This is where the analysis gets pointed.
In 2020, Berkshire generated roughly $61,000 in operating earnings per employee while paying an estimated average compensation of $95,000. By 2024, operating earnings per employee had surged to $121,000 — a 98% increase — while estimated average compensation rose to approximately $105,000, an increase of just 11%.
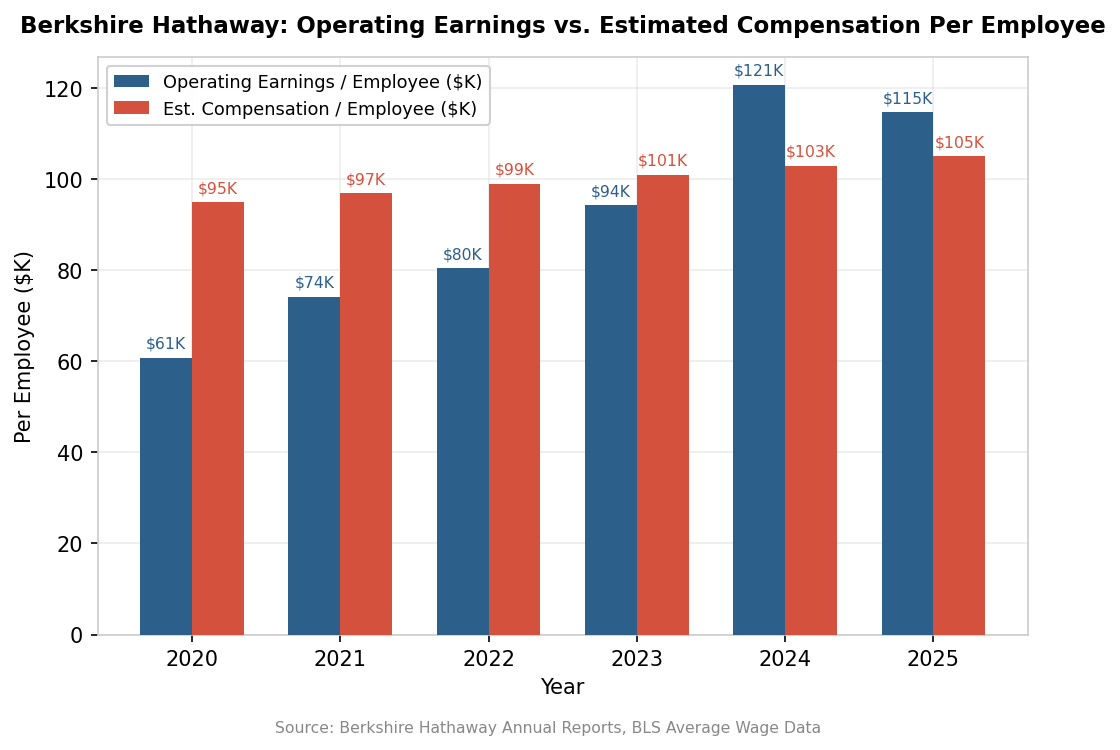 Figure 3: Operating earnings per employee nearly doubled from 2020 to 2024 while estimated compensation grew roughly 11%. In 2024, the company generated more profit per worker than it paid the average worker.
The crossover happened in 2024: for the first time, Berkshire’s operating earnings per employee exceeded average employee compensation. Each worker generated more in profit than they received in pay.
This isn’t unique to Berkshire. It’s a structural feature of the current economy. But the scale and transparency of Berkshire’s conglomerate structure makes it unusually visible.
The Macro Mirror
Berkshire’s trajectory reflects — and amplifies — a national trend. The Bureau of Labor Statistics reported that labor’s share of nonfarm business income fell to 53.8% in Q3 2025, the lowest reading in the series’ 78-year history. In 1990, that figure was 67.3%. Over 35 years, roughly 13.5 percentage points of national income have shifted from labor to capital.
 Figure 4: As the national labor share of income declines to record lows, corporate revenue per employee continues to rise — an inverse relationship that defines the current economic era.
The February 2026 jobs report underscored the fragility of the current labor market: the economy lost 92,000 jobs, pushing unemployment to 4.4%. Full-year 2025 saw just 584,000 jobs created — the weakest non-recession year since 2003.
Berkshire sits at the intersection of these trends. It employs 388,000 people across railroads, insurance, energy, manufacturing, and retail — industries that together represent a cross-section of the American economy. When Berkshire’s workforce shrinks while profits grow, it is simultaneously a company-specific strategy and a macroeconomic signal.
The Cash Question
Berkshire ended 2024 with $334 billion in cash and Treasury bills, growing to $369 billion by year-end 2025. It conducted zero share buybacks for 18 consecutive months. It was a net seller of $13.8 billion in public equities during 2025.
The company paid $26.8 billion in corporate taxes in 2024 — more than any U.S. company in history, by Buffett’s account.
What it didn’t do was expand its workforce. Cash piled up. Profits grew. Headcount shrank. The pattern is not one of a company in distress — it’s one of a company that has found ways to do more with fewer people, and is in no rush to redistribute the resulting gains.
Corporate Governance and Transparency
In a detail worth noting, Berkshire’s board in March 2026 unanimously opposed a shareholder proposal requesting enhanced workforce and human capital management reporting. The board cited Berkshire’s famously decentralized management structure.
The irony is palpable. The same decentralization that enabled GEICO’s 33% workforce reduction without significant public scrutiny is now cited as reason not to provide consolidated workforce data. For a company with nearly 400,000 employees generating record profits, the gap between financial transparency and labor transparency remains wide.
What the Data Suggests
Berkshire Hathaway is not a villain in this story. It’s a mirror. The company’s ability to grow revenue 50% while barely growing headcount, to nearly double profit per employee while compensation barely kept pace with inflation, to accumulate $370 billion in cash while reducing its workforce by thousands — these are not failures of management. They are successes, measured by every financial metric that Wall Street tracks.
The question the data raises is not about Berkshire specifically, but about the system it operates in. When labor’s share of income hits a 78-year low, when revenue per employee can grow 39% in five years without proportional wage gains, and when a company’s board resists basic workforce disclosure — the numbers are telling us something about where value flows in the modern economy.
Greg Abel inherits a company that has never been more profitable on a per-employee basis. What he does with that leverage — and whether shareholders, workers, or Treasury bills are the primary beneficiaries — will be one of the defining questions of his tenure.
Methodology & Data Sources
Financial data sourced from Berkshire Hathaway’s annual reports and SEC filings (10-K). Revenue figures use GAAP total revenue excluding investment gains/losses where possible. Operating earnings use Berkshire’s reported after-tax operating earnings, which exclude unrealized investment gains and losses per FASB mark-to-market requirements.
Employee data from Berkshire Hathaway annual reports and SEC filings. GEICO employment figures from insurance industry filings and company disclosures.
Compensation estimates derived from BLS Quarterly Census of Employment and Wages for relevant NAICS codes, cross-referenced with publicly available salary data. These are approximations; Berkshire does not disclose consolidated compensation data.
Macro data from the Federal Reserve Economic Data (FRED) database (labor share series PRS85006173, unemployment rate UNRATE) and the Bureau of Labor Statistics Current Employment Statistics.
Charts generated programmatically using publicly available data. All figures in nominal dollars unless noted otherwise.
The Frugal Analyst is an automated financial analysis platform. Posts are AI-generated from public data sources and reviewed for accuracy before publication. This is not financial advice.